H-Reflex
The H-reflex is the electrical
equivalent of the monosynaptic stretch reflex and is normally
obtained in only a few muscles. It is elicited by selectively
stimulating the Ia fibers of the posterior tibial or median
nerve. Such stimulation can be accomplished by using slow
(less than 1 pulse/second), long-duration (0.5-1 ms) stimuli
with gradually increasing stimulation strength.
The stimulus travels along the
Ia fibers, through the dorsal root ganglion, and is
transmitted across the central synapse to the anterior
horn cell which fires it down along the alpha motor
axon to the muscle. The result is a motor response,
usually between 0.5 and 5 mv in amplitude, occurring
at low stimulation strength, either before any direct
motor response (M) is seen or with a small M preceding
it. Understandably, the latency of this reflex is much
longer than that of the M response, and a sweep of 5-10
ms/division is necessary to see it.
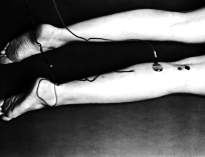
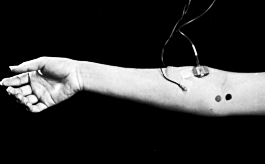
The H-reflex can normally be seen in many muscles but
is easily obtained in the soleus muscle (with posterior
tibial nerve stimulation at the popliteal fossa), the
flexor carpi radialis muscle (with median nerve stimulation
at the elbow), and the quadriceps (with femoral nerve
stimulation).
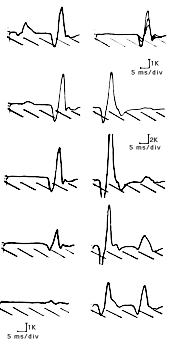
Typically, it is first seen at low stimulation strength
without any motor response preceding it. As the stimulation
strength is increased, the direct motor response appears.
With further increases in stimulation strengths, the
M response becomes larger and the H-reflex decreases
in amplitude. When the motor response becomes maximal,
the H-reflex disappears and is replaced by a small late
motor response, the F-wave.
H-reflex latency can be determined easily from charts,
according to height and sex or from published normal
values. Whatever these values however, the best normal
value in localized processes is the patient's asymptomatic
limb. If no facilitation maneuvers are performed, the
difference in latency between both sides should not
exceed l ms.
The H-reflex is useful in the diagnosis
of S1 and C7 root lesions as well as the study of proximal
nerve segments in either peripheral or proximal neuropathies.
Its absence or abnormal latency
on one side strongly indicates disease if a local process
is suspected. Much controversy remains, however, on
whether its absence bilaterally in otherwise asymptomatic
individuals is of any clinical significance.
F-Wave
The F-wave is a long latency
muscle action potential seen after supramaximal stimulation
to a nerve. Although elicitable in a variety of muscles,
it is best obtained in the small foot and hand muscles.
It is generally accepted that the F-wave is elicited when
the stimulus travels antidromically along the motor fibers
and reaches the anterior horn cell at a critical time
to depolarize it. The response is then fired down along
the axon and causes a minimal contraction of the muscle.
Unlike the H-reflex, the F-wave is always preceded by
a motor response and its amplitude is rather small, usually
in the range of 0.2-0.5 mv.
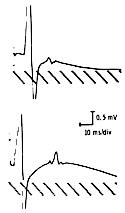
The F-wave is a variable response and is obtained infrequently
after nerve stimulation. Commonly, several supramaximal
stimuli are needed before an F-response is seen since
only few stimuli reach the anterior horn cell at the
appropriate time to depolarize it. With supramaximal
stimulation however, depolarization of the entire nerve
helps spread the stimulus to the pool of anterior horn
cells thus enhancing its chances to reach a greater
number of anterior horn cells at the critical time and
produce an F-wave.
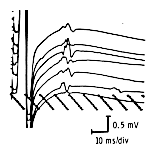
Because different anterior horn cells are activated
at different times, the shape and latency of F-waves
are different from one another. Conventionally, ten
to twenty F-waves are obtained and the shortest latency
F-wave among them is used.
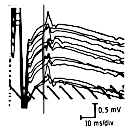
The normal values can be determined from charts or published
data and, in unilateral lesions, the best normal values
remain those of the patient's asymptomatic limb. The
difference between both sides' shortest latencies should
not exceed l ms.
The data obtained from the F-wave
have been used in many different ways to determine proximal
or distal pathology. Those include the F-wave chronodispersion
or difference in latency between the F-wave with the
shortest and that with the longest latency, and the
F-wave ratio. We find the F-wave ratio very useful in
routine clinical work. It is obtained by dividing the
conduction time of the proximal nerve segment by that
of the distal nerve segment and is performed as follows:
Obtain the F-wave latency from
proximal (F prox) stimulation (knee or elbow). Obtain
the motor response likewise from proximal stimulation
(M prox). Then determine the latency of the proximal
nerve segment by this equation:
Proximal latency = (Fprox -
Mprox - 1 ms) / 2
where l ms is the estimated delay
encountered by the stimulus at the anterior horn cell.
The latency of the distal segment
is none other than the motor response latency obtained
from proximal stimulation (M prox).
The F-ratio is then obtained by
dividing the proximal latency by the distal latency:
F-ratio = (Fprox - Mprox - 1
ms) / 2 x Mprox
Normal F-wave ratios are obtained
from published data (Table XVIII).
The F-wave ratio can be used as
follows:
With normal routine conduction
velocity:
- A normal F-ratio indicates normal distal and proximal
segments
- A decreased F-ratio indicates a distal nerve lesion
or entrapment (such as carpal tunnel)
- An increased F-ratio indicates proximal slowing
With slowed routine conduction
velocity:
- A normal F-ratio indicates equal proximal and distal
slowing
- A decreased F-ratio indicates a normal proximal segment
- An increased F-ratio indicates a predominant involvement
of the proximal nerve segment
|


